


In the second round, the biggest discrepancy in the advanced stats vs. eye test model is in the Washington-Pittsburgh series.
 Advanced stats vs. the eye test: Who are the new favorites heading into Round 2?
With round one in the books (and round two already begun thanks to very odd scheduling by the NHL) it’s time to check back in on the advanced stats vs. eye test debate.
Before the playoffs started we showed you three sets of predictions: one based on numbers, one based on eyes, and one based on both. They mostly agreed on each series to varying levels, but there were some differences. Here’s the first round scorecard.
ROUND ONE RECAP
STL vs. CHI: A win for the numbers crowd as the Blues finally slayed the dragon that was their Central division foe. In fairness, the numbers saw St. Louis as clearly superior, but the series played out pretty evenly.
PIT vs. NYR: Another win for the numbers crowd, this one being much more decisive. The Rangers never looked like they were in this series which is something the stats predicted as this looked like the biggest mismatch. Eye test said this would be much closer, though they still favoured the Pens.
WSH vs. PHI: A win for the eye test as Washington dominated the series pretty much from start to finish. Were it not for Neuvirth’s super-human performance it would’ve been a sweep. The stats model thought this series would be closer. The opposite of the PIT vs. NYR series.
LAK vs. SJS: Technically a loss for both views as they both liked the Kings to win it. But stats liked San Jose’s upset chances a lot more than the eye test did.
The first round looked good for the numbers side, sure, but let’s keep in mind that it’s only eight series here. Regardless, we’ll have to make some adjustments for round two.
ADJUSTMENTS
First off, the numbers will be weighted just a little bit more than the eye test now, at a 55/45 split, thanks to its first round superiority.
Secondly, some adjustments have to be made to the weights for the four categories of the eye test (offence, defence, goaltending, and intangibles) based on which of the four was most accurate. The original survey viewed defence as most important followed by goaltending. That’s not exactly a wrong view point, but for the sake of predictions it proved incorrect. As it turns out, the most important aspect is actually offence.
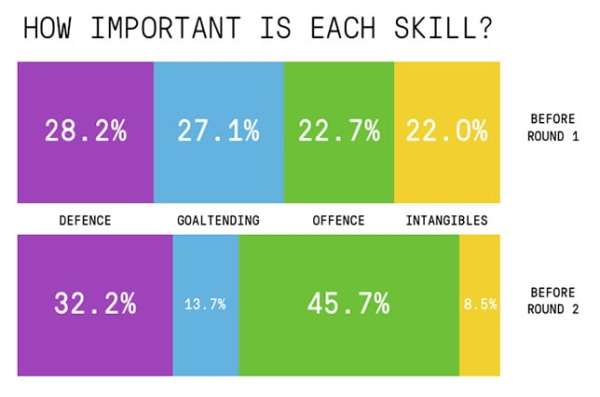
Combining defence with goaltending though makes it equal to offence. That makes a lot more sense than the original weights which put a bit too much emphasis toward one side of the ice. Goaltending takes a lesser role now and it’s not because it’s not important, it’s more that it’s so unpredictable in the playoffs.
Not many saw Henrik Lundqvist getting lit up the way he did, or Martin Jones and Thomas Greiss out-duelling Jonathan Quick and Roberto Luongo respectively. But it happened, and it’s due to the unpredictable nature of goaltending. It’s important, but not so much for forecasting purposes. That, and the fact that a goalie is just one player. A very important one, yes, but good teams can overcome them even though sometimes it’s a terrifying experience for everyone involved (see Stars, Dallas).
Then there’s intangibles, which turned out to be quite overvalued, as I initially suspected. With San Jose, St. Louis and Nashville pulling through despite the huge discrepancy in intangibles, their value gets diminished.
With that being said, here’s what’s gonna happen in round two – probably.
‘WHAT THE STATS SAY’
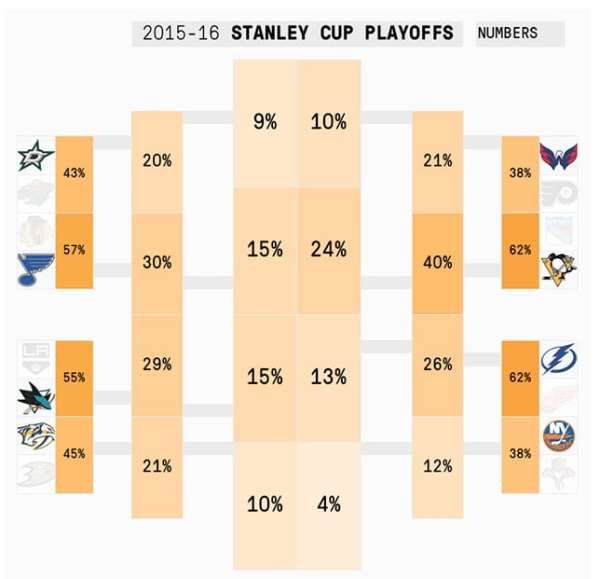
Note: After Wednesday night’s game, the Islanders are now at 55 percent.
The likeliest matchup is between Pittsburgh and St. Louis, although the Sharks are seen as a tiny bit stronger than the Blues with a slightly tougher round two matchup. There’s clear favourites in every series, but it’s a lot closer out West than it is in the East where the Penguins and Lightning have a clear edge.
‘WHAT THE EYES SEE’
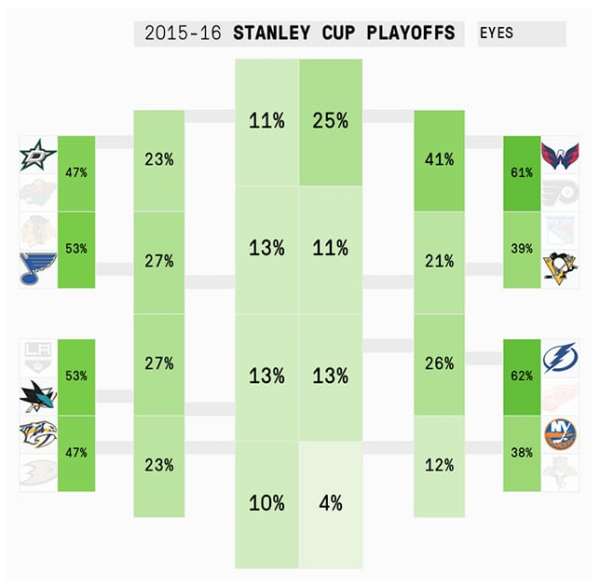
Note: After Wednesday night’s game, the Islanders are now at 55 percent.
With the Kings and Blackhawks out, the Cup is Washington’s to lose. Pittsburgh has been hot, sure, but Washington has been the stronger team all season. The margins are slim in the West, but St. Louis and San Jose seem like the favourites in their series. If they meet in round three, it’ll be a virtual coin-flip to decide who represents the West.
SIMILARITIES
Tampa Bay looks like the easy pick against New York based on both methods. The Islanders were outplayed for most of their series against Florida, but squeaked out a win anyway on the shoulders of Greiss. It’s unlikely he can repeat the feat against Ben Bishop.
San Jose vs. Nashville looks to be a close series for both methods with San Jose coming out on top each time. Both teams are rated a fair bit stronger by stats than by the eyes, but the difference is close enough that the series itself looks similar by both methods.
Teams they agree on: Tampa Bay, Islanders
First Round series they agree on: TB vs. NYI
DIFFERENCES
The big difference is between the two juggernauts of the East, Washington and Pittsburgh. Both methods think one team has a sizeable edge, but they don’t agree on who that is exactly. Stats like Pittsburgh, eyes like Washington. What’s interesting though is that Washington was the more dominant possession team (against a stronger shot rate opponent too) in round one, while the Penguins were much closer to even. A departure from how each team entered the postseason and a reason why opinions are currently so different.
As for the other West series, the eye test likes Dallas to make it closer, especially after the new weights that emphasize their offensive skill. Stats think St. Louis has a pretty big edge here, although the gap is still pretty close.
In terms of Cup favourites, it pretty much comes down to Pittsburgh and Washington, but it depends on who you ask. The West is a toss-up with a small lean towards San Jose and St. Louis from the eye test and a slightly bigger lean based on the numbers.
Teams the numbers like more: Pittsburgh, San Jose, St. Louis, Nashville
Teams the eye test likes more: Washington, Dallas
First Round series that are closer than they seem according to the numbers: None
First Round series that are closer than they seem according to the eye test: DAL vs. STL, SJ vs. NSH
Series they completely disagree on: WSH vs. PIT
WHY NOT BOTH?
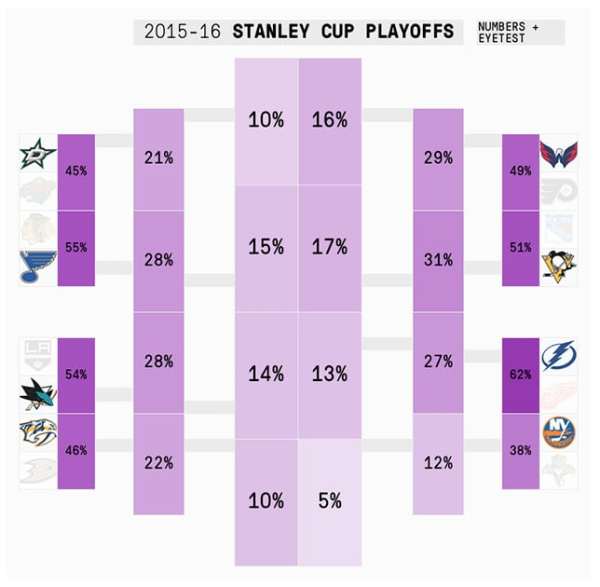
Note: After Wednesday night’s game, the Islanders are now at 55 percent.
There’s only one big change from the aggregate model this time around and that’s meeting right in the middle for Pittsburgh vs. Washington series. The series turns into a very even split which just makes sense considering how both teams are playing. Pittsburgh gets a very slight edge here thanks to the 55/45 split towards the stats model.
Again, these won’t be 100 percent accurate, but they did do a decent job in projecting the first round. We’ll see if it can do the same for the second and also which of the numbers or the eye test comes out on top this time around.


